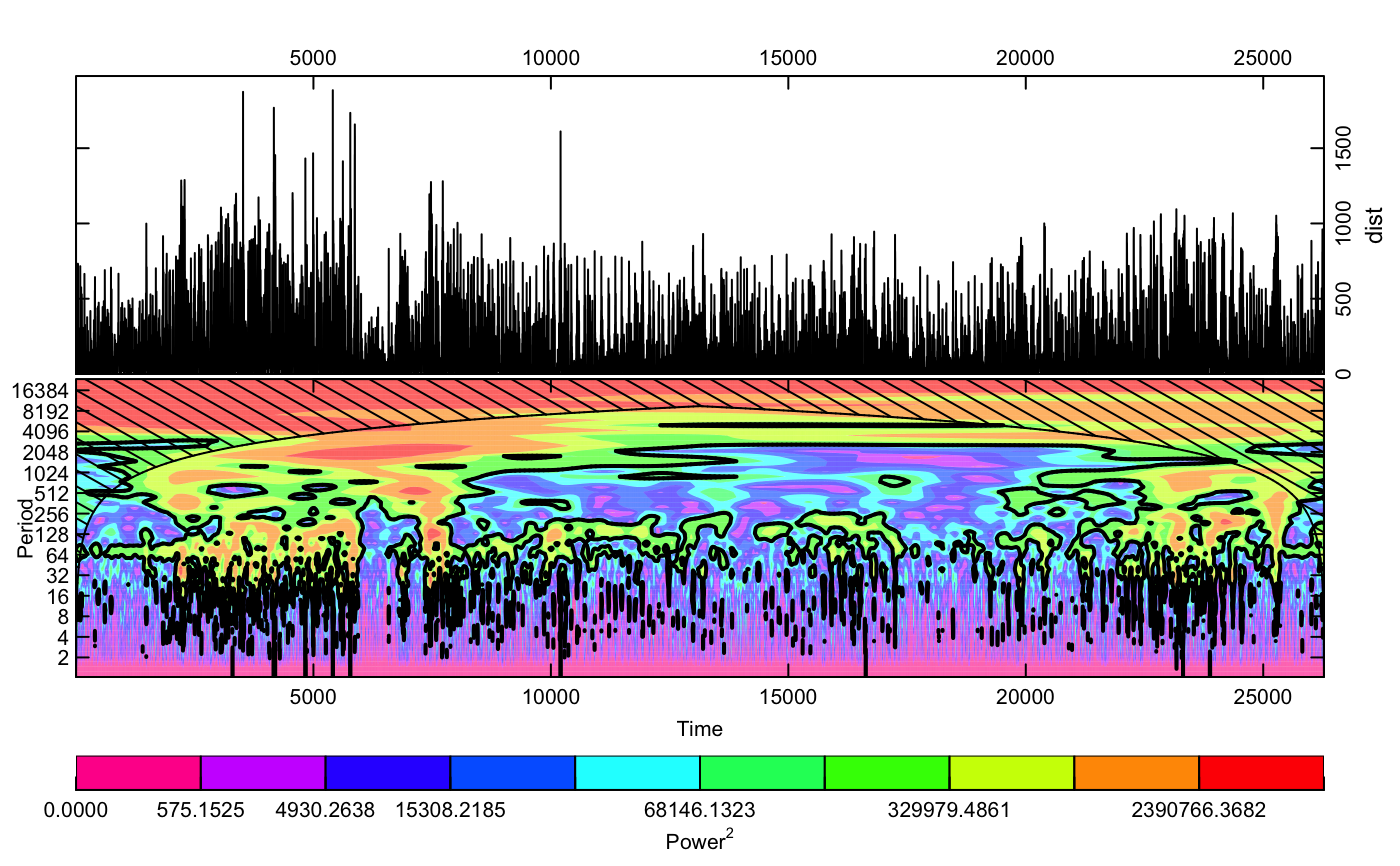
Build morelet wavelet diagrams for step size, turning angle, auto and cross correlation coefficients through time.
wavelet(df, stats = c("dist", "rel.angle", "acf_dist", "acf_ang", "ccf"),
  plot = T, ...)
Arguments
| df | a dataframe with columns: x, y, date |
|---|---|
| stats | a character vector indicating which variables to calculate wavelet analysis on, options in "dist", "rel.angle", "acf_dist", "acf_ang", and "ccf". By default, analysis is run on all 5. |
| plot | a logical indicating whether or not to return a histogram of the distribution |
| ... | Arguments passed to wavelet.plot. Only relevant when |
Examples
dist_wave <- wavelet(AG195, stats = "dist", UseRaster = T)