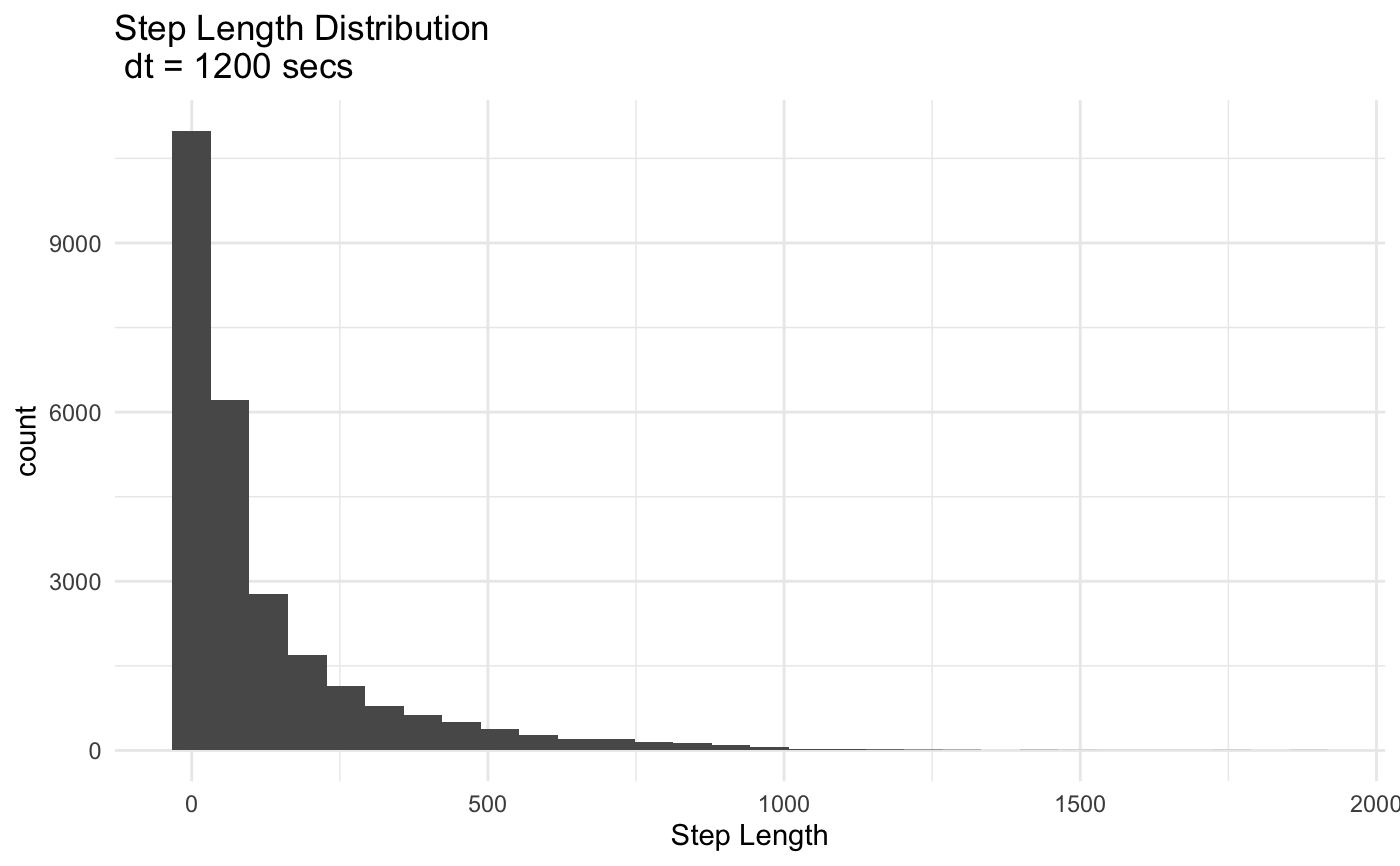
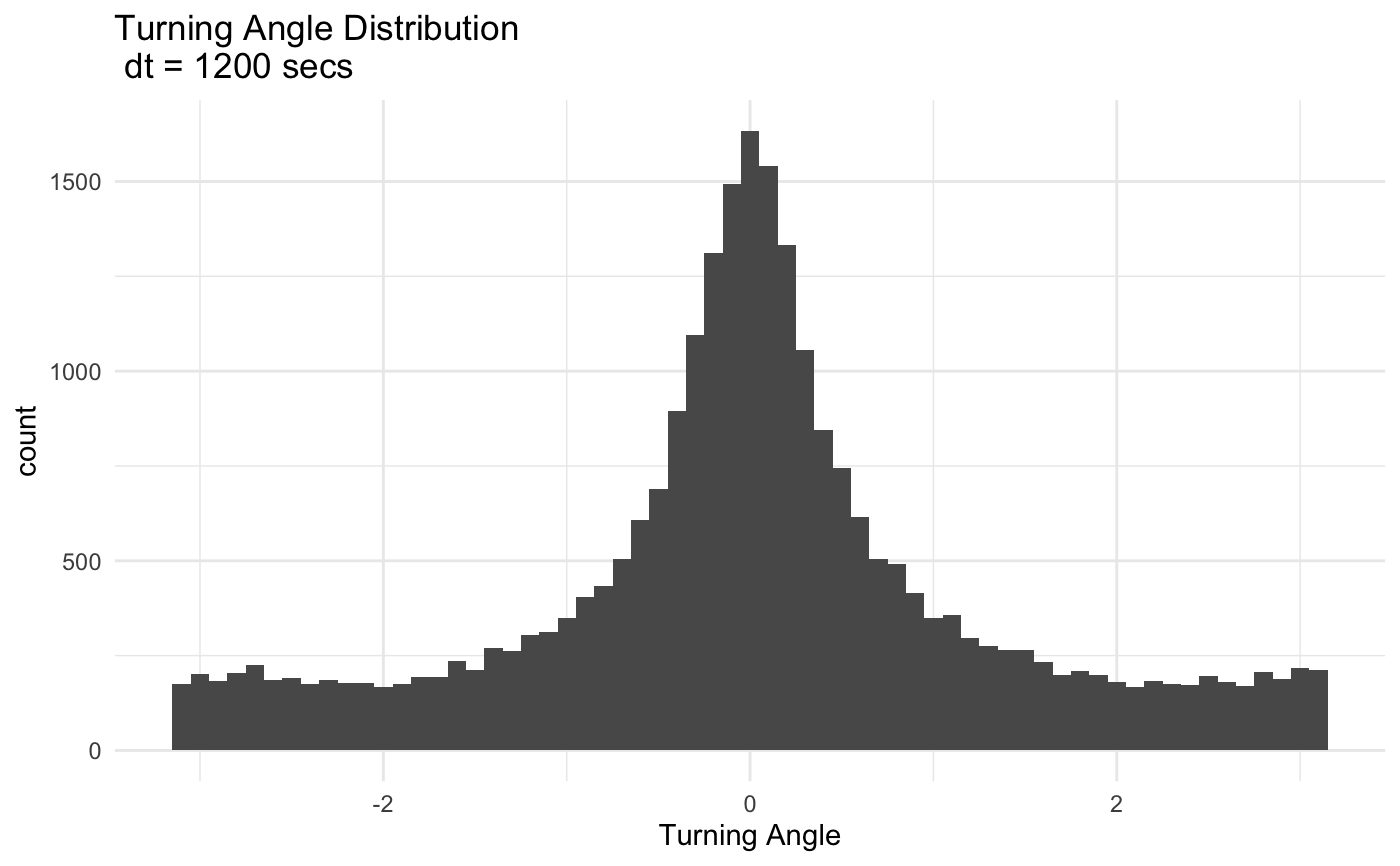
The first step to any movement analysis is to extract the step length and turning angle distributions of trajectory. These functions will calculate step length and relative turning angles for a given trajectory and plot associated histograms.
ss_dist(x, plot = T)

ta_dist(x, plot = T)
Arguments
| x | a dataframe with columns: x, y, date, and id (optional) |
|---|---|
| plot | a logical indicating whether or not to return a histogram of the distribution |
Value
a numeric vector and (optionally) a plot of the turning angle or step length distribution
Examples
ss <- ss_dist(AG195)#> Warning: Removed 1 rows containing non-finite values (stat_bin).ta <- ta_dist(AG195)#> Warning: Removed 13 rows containing non-finite values (stat_bin).